|
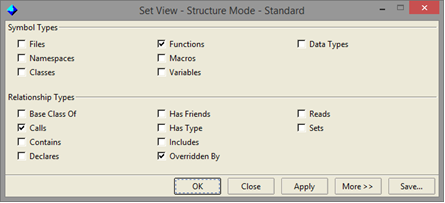
Structure ViewsThe structure views enables you to systematically study your software on any level -- from its high level architecture to the details of its build, procedural, data and class dependencies.For any given software project, the amount of data in the Imagix 4D database may be quite large. Graphical analysis involves focusing the Graph window on the specific information of current interest. This starts with the View mechanism, where you control the types of symbols and relationships that can be displayed in the graph. With the structure views, you have the ability to specify which relationship types are viewable, and you have the widest and most granular set of symbol types to chose from. You can examine the quantitative characteristics of your software, such as the complexity of the functions or how completely your test cases exercise your code. Software metrics information can be presented in the Graph window, through the use of color-coding to indicate the metrics value associated with each symbol. Color-coding is also available to indicate functions identified by certain of the Flow Check reports. Through the checkboxes below the Graph window, you control the appearance and layout of the graph. The dimension and direction settings adjust the graph so that it is easy for you to view the current contents. The layout and starting point settings change where symbols are placed relative to one another in the graph. These can impact how quickly and how completely you are able to understand the inherent structure and dependencies represented in the graph. Range of ViewsThe Imagix 4D database contains information about the various symbols in your software and their relationships to one another. A symbol is an object or element in your software. Examples include header files, classes and macros. A relationship is a directed association between two symbols, such as a call by one function to another, or a variable using a datatype in its declaration.Overall, the symbol and relationship information collected by Imagix 4D covers many, many aspects of your software. These aspects range from include dependencies between files, to class derivations from other classes, to variables being set and read. With the structure views, all of this information is potentially viewable. To help you analyze specific aspects of your software, the view mechanism enables you to control which specific symbol and relationship types are viewable in the Graph window. The normal approach is to select one of the structure views listed in the View menu. Depending on the types of symbols contained in your project, the menu lists up to ten structure views. With these pre-defined combinations of symbol and relationship types, you're able to examine many of the structural aspects of your software that you'll commonly be interested in. For example, the Function Calls with Variables view enables you to examine the calling hierarchy of the functions in your software, and at the same time, see how global and static variables are set and read among those functions.
For example, if you disable variables, then the set and read relationships from functions to variables will also disappear from the graph, as there are no visible symbols being set or read. There may be times with Set View when you want to explicitly limit what relationships are displayed. For example, you may want to see all of the variables set by a function, but not be interested in variables that are read by a function. Controlling which relationships are visible effects not only the layout of the current graph, but also what symbols are added when doing a relationships query through the Add function. If you have particular combinations of symbol and relationship types that you find yourself using a lot, you can use the Save function in the Set View dialog to add the view to the list of existing view definitions. Graph AppearanceYou can also control the appearance of the graph, so that it presents the data in a manner that is easy for you to view and understand. By changing the appearance and layout of the symbols in the Graph window, you can optimize the display to enhance your understanding of the structure and dependencies inherent in the code you're studying.
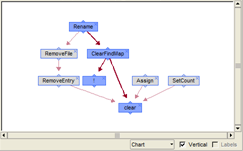
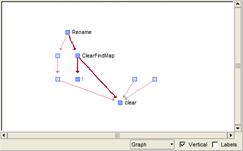
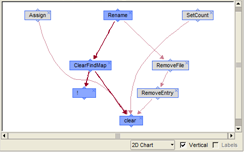
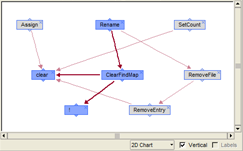
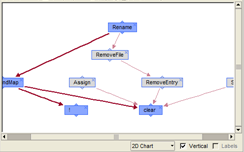
These displays are equivalent; only their appearance differs and you can use any one at any time. You may find that the chart display is most useful for studying the actual symbols and dependencies involved, while the graph displays help most with understanding the structure the dependencies among the visible symbols. Likewise, the Vertical checkbox also effects just the appearance of the graph without changing its logical layout. The checkbox controls whether the display is drawn in a top to bottom (vertical), or left to right (horizontal) direction. You may find that you have a preference for a consistent direction. Alternatively, you may want to change the direction to improve the readability or intuitiveness of the graph. Graph LayoutLayout, in addition to appearance, can be controlled. Menubutton and checkbox controls are located at the bottom of the Graph window for easy accessability, as you may often find that modifying the layout will improve the layout for your current analysis.All of the relationships between symbols have a direction. For example, the sets relationship, which occurs when a function assigns a value to a variable, has a direction from the function to the variable. Any symbol visible in the graph that has no relationships directed into it from other visible symbols is considered a root. Any visible symbol that has no relationships directed out from it to other visible symbols is considered a leaf.
Often, you'll want to see things starting from the roots. Suppose that you're viewing a function calling hierarchy, you've isolated the subtree of function X, and now you want to study that subtree. A roots layout will clearly indicate which functions are called directly by X, and then which additional functions are used by those functions. However, there will be many instances where the leaves layout is appropriate. Suppose that you're again looking at a calling hierarchy, but now want to understand how a variable is used. A graph with compact / leaves layout will show which functions are directly setting or reading the variable, and the functions calling those functions.
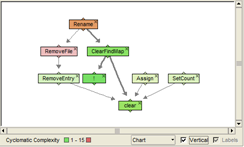
Metrics and Report Results
When selecting a metric, you can also choose whether the colors indicate relative values among the symbols displayed in the graph, or reflect each symbol's value compared to the thresholds that you have determined. In the case of relative values, the current range are displayed at the bottom of the graph. For thresholds, you're able able to set them through the File > Options dialog. Alternatively, Display settings can be used to identify the functions reported by certain of the Flow Checks. In particular, when you're using the Graph window to analyze your software in order to examine the issues reported by the various Task Flow Checks, you may find it very useful to identify functions not used in tasks.
|