Applying Imagix 4D
Applying
| When you apply Imagix 4D, a wide range of tasks in understanding, analyzing and documenting your complex or legacy software become easier, and you become more productive. The tool visually presents information about the key aspects of your source code, and enables you to quickly focus those views to answer the particular questions you're facing. Complementing the interactive use of the reverse engineering tool, you're also able to automatically generate documents, speeding tasks ranging from conducting code reviews to reporting design and quality issues to delivering as-built documentation. Here are examples of how Imagix 4D can be used. Notes and videos show Imagix 4D being applied to analyze some specific aspects of representative source code. Static screen shots provide further insight into certain general capabilities of the tool. And document samples display some of the content and format possible in automatically generated documentation. Together, these are intended to be illuminating rather than exhaustive. Our hope is that you'll see enough to decide to download the trial software, and evaluate how it handles your specific applications. |
Video demos and sample
screens from Imagix 4D
Application Notes and Videos

Imagix 4D contains a number of component tools and reports, each very useful in its own right. But critical in Imagix 4D's overall effectiveness is how the various tools work together to provide you the critical information you need, quickly and accurately.
These app notes and videos show Imagix 4D being used in common software development tasks. Even if these aren't the precise tasks you're facing today, you'll get a sense of how Imagix 4D's visualization and analysis can be applied to make you more productive.
Graphs and Other Tools

Imagix 4D includes a series of tools to help you analyze your source code's inherent structure and dependencies. Many of these use visualization for faster and more accurate understanding.
Primary among these are the Graph windows. They provide a range of over 15 views covering different aspects of your code.
Complementing the Graph windows are a number of additional displays, each optimized to speed analysis and comprehension of a specific aspect of your software.
Reports and Metrics

Complementing the tool displays, the Reports and the Metric windows analyze and present information about the full scope of your software project. They provide project-wide insight, typically through measurements and checks that aid in assessing and improving the quality of your source code.
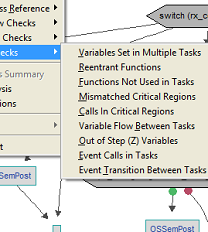
Significant among these are over a dozen flow check reports. These apply data flow analysis technology to identify potential runtime problems, particularly for embedded or multi-tasking systems.
Data Flow Check Reports
Metrics and Additional Reports
Sample Documents

Documents generated by Imagix 4D can be optimized for a wide range of uses. The samples included here show some of what's possible as far as content and format.
What these samples aren't able to show is degree of the automation involved in the process. Typically, you just focus the part of your source code you're interested in, click a couple of buttons, and end up with a precise, comprehensive document. And reference documents can be kept current through batch commands.
Sample Documents
- Project Documentation - Systematically describes and navigates the entire scope of your project (html)
- Code Reviews - Collects, organizes and presents information about the module being reviewed (rtf > pdf)
- Impact Analysis - Details the functions and data variables involved in the specific control flow being studied (html)
Close


