|
|
UML Task Collaboration Diagrams
In multi-tasking and multi-threaded systems, global and static variables present a special challenge. Sharing variables across tasks or threads can provide a mechanism for data passing and communication between the tasks. However, unintentional interference in one task's data by another task can lead to concurrency issues that are difficult to track down as well as potentially catastrophic. Careful design, including proper utilization of interrupt or semaphore protection, is critical in insuring safe, reliable execution of multi-tasking software.
Imagix 4D's UML Task Collaboration Diagram view provides insight into the use of shared variables in multi-tasking, multi-threaded systems. Derived from the COMET methodology described by Hassan Gomaa, the generated diagrams form an important tool for reverse engineering existing software. The diagrams indicate how variables are set and read across tasks, and provide a means of analyzing critical region protection schemes.
Use of the UML Task Collaboration Diagram starts with the definition of tasks (or threads). Because tasks are not explicitly designated in C/C++ or Java source code, Imagix 4D provides the ability to define tasks through the Task Definitions dialog. These same task definitions are also used for the various Task Flow Check reports.
Tasks are defined by specifying their root function.
Imagix 4D uses these task definitions in the data flow analysis that underlies the task collaboration graphs. All global and static variables accessed by more than one task are identified. In the resulting diagram, variables are grouped together on the basis of which combination of tasks access them.
Tasks (blue boxes) including specific functions are shown on the left, and variables are grouped (green boxes) on the right. Use of a variable is indicated as a set (aqua line) and/or a read (orange line).
For every set and read of a shared variable, the access is analyzed to determine whether it occurs within a protected critical region. Here again the source code does not contain explicit designation of critical regions; the interrupt functions or semaphores specification required here is also used for the Task Flow Check reports. In reviewing variable usage, unprotected variable access typically presents the greatest risk, and may signal a design or implementation error.
Variable access is indicated as either occurring in a protected critical region (thin lines) or not (thick lines). When multiple critical regions are defined, the diagram can be set to indicate the protection for each region.
As with all other Imagix 4D graphic views, one key feature is the ability to graphically query or manipulate the diagram to focus on the specific aspect of interest. For the UML Task Collaboration Diagram, the Display Format dialog provides additional filtering mechanisms so that only the variable usage meeting specific criteria is displayed.
The Display Format dialog provides a range of filters of the variable usage.
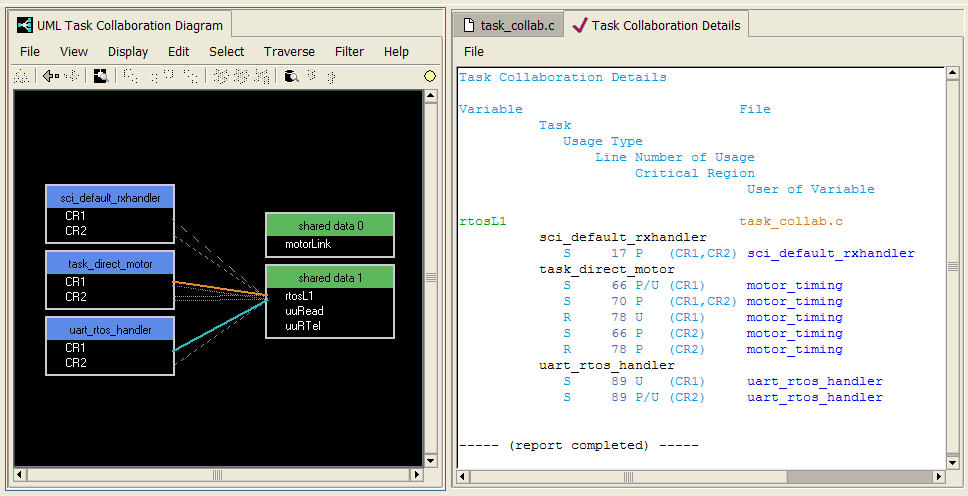
Complimenting the graphic view of the UML Task Collaboration Diagram is a tabular report that provides detail about the specific variable usage currently displayed in the diagram. As filtering and focusing is done in the diagram, the report stays synchronized. The indication of specific lines of source code include links for browsing to the code with Imagix 4D's file editors.
Side-by-side with the diagram, the Task Collaboration Details report provides navigation support as well as additional analysis results. (Full Size)
|
Using the UML Task
Collaboration Diagrams


