|
|
Quantitative Analysis of Architectures
Imagix 4D's Subsystem Architecture Diagrams provide insight into the partitioning and layering of a software system. Drilling down into a subsystem reveals its interior decomposition of the further subsystems. In the resulting diagrams, the dependencies between visible subsystems can also be seen.
These views can be used to improve understanding of the code. Initial, high level diagrams provide insight into the overall components making up a software system. As navigation drills down to examine particular parts of the code and follow certain dependencies, the diagrams continue to provide valuable perspective about which portions of the overall architecture are involved in a specific flow of control.
The diagrams also provide a valuable tool for improving the architecture via analysis and modeling. By using the diagrams to experiment with alternative partitioning and layering, the impact of changes to the architecture can be examined.
The use of Subsystem Architecture Diagrams in both these tasks - understanding existing code and improving its architecture - is enhanced by the integration of software metrics into the subsystem architecture displays. This integration provides a framework for visualization and quantitative analysis for specific tasks ranging from classifying the major components of the code to identifying subsystems that might be sub optimally partitioned or layered.
Imagix 4D generates over 25 metrics about each subsystem. These metrics can be viewed and analyzed in Imagix 4D's standard metrics displays. There is a specific window for viewing subsystem metrics.
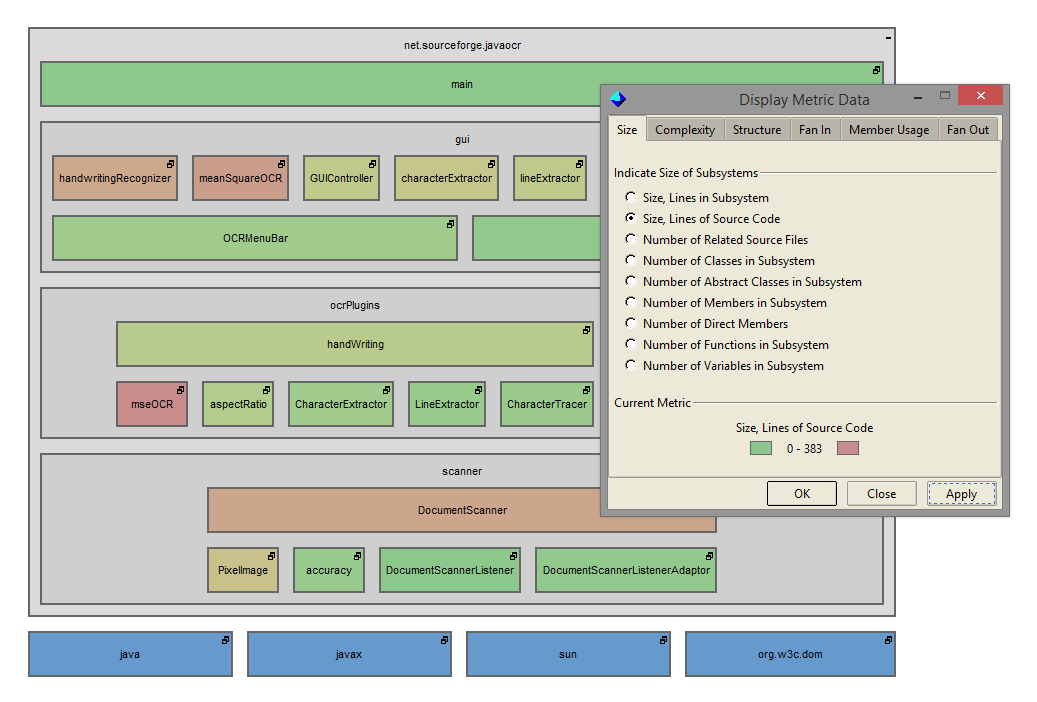
But viewing the metrics within the Subsystem Architecture Diagrams themselves provides special value. As you examine the subsystems, their layering and relationships, you're able to perceive their relative significance, the complexity they represent, and the quality of their architectural partitioning.
The green-yellow-red spectrum used in shading reflects each subsystem's value for the selected metric relative to the other leaf subsystems in the display. Here, the redder subsystems contain the most lines of source code. (Full Size)
Which metrics you decide to display will depend upon what you're trying to achieve.
Size
- Measures - The scope of the source code represented by the subsystem, such as lines of source code, number of functions, etc.
- Use - Understand subsystem significance, find unbalanced partitioning, estimate testing and maintenance requirements.
Complexity
- Measures - The total, average and maximum cyclomatic complexity of the functions contained in the subsystem.
- Use - Monitor quality of coding, manage quality risk and testing efforts.
Structure
- Measures - The stability, instability, usage, abstractness and architectural violations of the subsystem in the context of the full system.
- Use - Improve the design of the system's overall architecture.
Fan-In
- Measures - The subsystem's use, how widely its members are accessed externally.
- Use - Focus testing, estimate refactoring costs, identify potential candidates for reuse.
Member Usage
- Measures - The subsystem's cohesion, how much use it makes of its internal members.
- Use - Review structure for better maintenance, refactoring for better reuse.
Fan-Out
- Measures - The subsystem's coupling, how much use it makes of external functions and variables.
- Use - Focus code reviews, assess subsystem boundaries and potential restructuring.
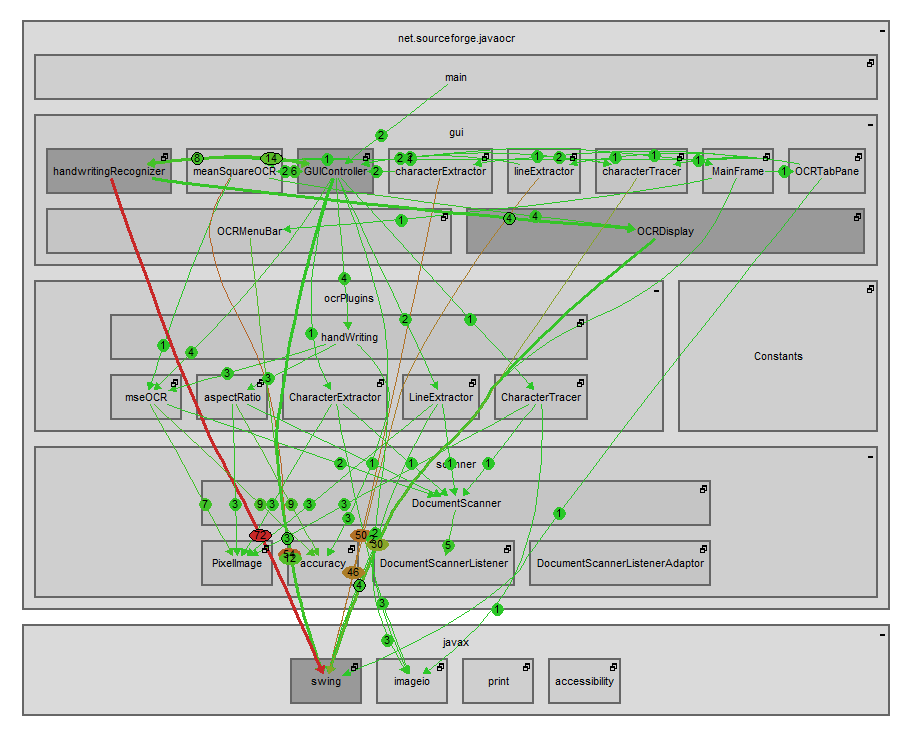
The inter-relatedness of subsystems can also be analyzed graphically. Through a display option, you're able to see the strength of the dependency relationships between subsystems. You can determine whether a layering issue is the result of a couple of subsystem members that might be repackaged, or instead represents a systemic problem that calls for some architectural changes.
Under the Relationship Strength option, colors and numbers indicate the number of underlying members involved in each dependency between two subsystems. (Full Size)
|
Software Metrics and
Subsystem Architecture Diagrams