
Automated Document Generation
Automated
| Working in software development, software maintenance or quality assurance, one of your least desirable and least rewarding tasks is creating documentation. Whether it's for code you're creating, a change you're contemplating, or a problem that you're trying to resolve, the actual task of documentation is often dull and unimaginative. And under tight schedules, there seem to be better uses of your time. Yet detailed, accurate, up-to-date documentation is of enormous value. It helps insure that changes made to the source code don't create unforeseen problems. It speeds and focuses software peer review efforts. It lowers the likelihood of misunderstandings among developers and quality assurance teams. It alleviates the need to spend time hand-holding new engineers as they get up to speed. Research indicates that 5% to 15% of development effort goes into software documentation. Automating extensive portions of this task by reverse engineering your source code, you can save significant effort, get more accurate documents, focus on where you add value, and eliminate some genuinely tedious work. | |
Documentation for
existing source code


Design Documents
Whether you're working with source code you've developed or inherited, 3rd party or open source, Imagix 4D can automatically generate comprehensive as-built documents to help with understanding, augmenting and archiving your software.
Spanning your full system, the design level documentation provides precise, extensively detailed, easily navigatable information and analysis of your software. And with Imagix 4D's automation, you can be certain that the documents remain current and accurate. All without spending a lot of time.
Document provides high-level info:
- Descriptions and analysis at the architecture, file, package, namespace and class levels
- Graphic displays of interfaces, usage and external dependencies
- Over 80 metrics including object-oriented and cyclomatic complexity
- Function flow charts
- Variable sets and reads
- Type usage cross-reference
Code Review Documents
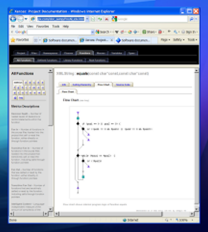
Imagix 4D generated documents can serve as a platform for peer code reviews. For a structured walkthrough of a given file, class or symbol, you're able to automatically generate a comprehensive document. Documentation templates insure that the contents and format are optimized for your standard software review processes.
You're even able to include Imagix 4D's built-in structural and quality analysis. Automating the generation of review materials frees you up to focus your efforts on the actual source code review itself.
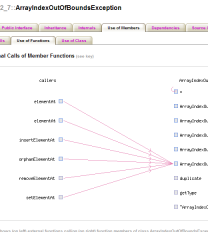
If you're reviewing a class, 11 class-level graphs include:
- Public function interface
- Class inheritance hierarchy
- Internal function hierarchy
- Use of member variables
- External function dependencies
- External variable dependencies
- Object-oriented metrics
- Public members
- Use of class
- Over 25 source code checks
Impact or Problem Analysis
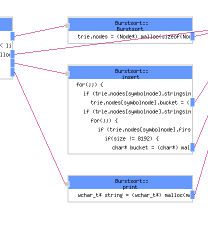
The source code analysis functionality of Imagix 4D makes it ideal for examining the control flow and dependencies within your code. While doing so, you may want to record your findings for communication or reference purposes.
The document feature provides a way to automatically capture a thorough, focused description of the particular control flow you are examining. It pulls together information about each of the specific functions and variables involved, highlighting their control flow involvement.
For each function involved, the report highlights control flow within:
- Cross reference graph
- Flow chart
- Source code
- Targeted function call tree or
- Control flow graph
- Over 15 metrics per function
- Over 20 source code checks
- Sections for each variable involved
Automated Generation
Using information in the Imagix 4D database and portions of the source code itself, the tool thoroughly documents each component (file, class, function, etc.) in the software. Once you have initially loaded your code into Imagix 4D, the entire process can be automated so that the documents remain accurate and current, reflecting the latest status of your code.
The resulting output is available in a number of formats. HTML supports easy lookup and navigation. RTF can be loaded into a word processor for further enhancement, and for generation of hard copy or .pdf files.
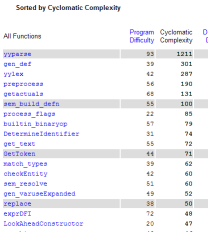
Direct HTML navigation embedded throughout:
- Sortable tables of over 80 cyclomatic complexity, object oriented and other metrics
- Graphs of symbol's external interface, member hierarchies, usage and dependencies
- Lookup indices of symbols by name and kind
- Extensive information tables
- All symbol references in source code definitions and file listings
Graph Export
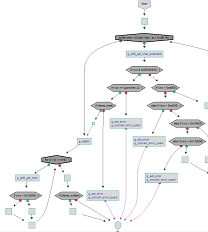
Imagix 4D graphs range from UML class diagrams to architecture diagrams to flow charts. Once you've explored a specific aspect of your software and seen the relevant structure and dependencies, you may want to export the graph in order to archive, share or analyze it further.
In addition to direct output to a printer, Imagix 4D provides a number of alternative formats for exporting the graph to a file. Under most formats, you can control the image size, background color, and conversion to grayscale.
File formats include:
- png for import into on-line documents
- ps/eps for import into word processors
- vdx for import into Microsoft Visio
- txt (for certain graphs) for post-processing
Close